Eppley Institute for Cancer Research
University of Nebraska Medical Center
| Home | - | Introduction | - | CommonTasks | - | Index | - | About |
|
Eppley Institute for Cancer Research |
|||||||||
|
University of Nebraska Medical Center |
|||||||||
|
The Fit Manager can be accessed from the Data menu and also from Statistics Windows.
The Fit Manager is used to fit Gaussians to reflection profiles.
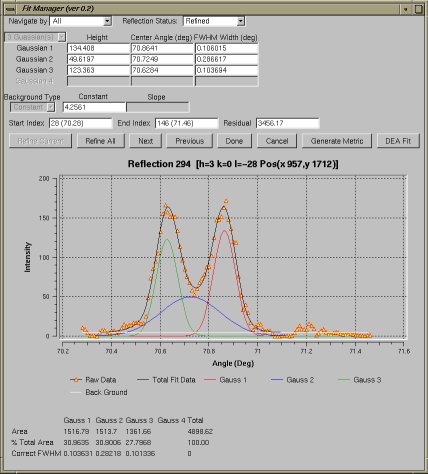
The Fit Manager is vertically divided into 5 sections. The top section provides reflection status information. Reflections can have 4 possible status codes. They are:
- Not Fit - This reflection has never been fit
- Fit - This reflection contains data that is saved in the fit file
- Need Refined - This reflection has default fit information and will be refined
- Refined - This reflection has been refined but has not been saved to the fit file yet
There are two options. The first indicates how reflection will be navigated based on status. The second allows the user to change the status of a reflection. Most commonly from Not Fit to Needs Refined.
The next section provides some tables that allow the user to adjust the Gaussian fit parameters. The values can only be changed for reflections that are in the Needs Refined state. The user can adjust the number of Gaussians, the three parameters for each Gaussian, the Background Type, values for the background and the window in which the Gaussians will be fit. For reflections in the Fit or Refined states the values show the results of the latest refinement performed on a reflection. The residual shows the sum of squared errors for the previous fit. A zero for residual typically indicates that no fit has been performed.
The next section provides navigation and command buttons. The navigation buttons are next and previous to move to the next or previous reflection as defined by the navigate by option. The commands are:
- Refine Current - Refine the current reflection with the Levenburg - Marquette method
- Refine All - Refine all reflections with a status of Needs Refined prompt the use for the method
- Done - Save all reflections with a status of Refined to the fit file
- Cancel - Discard all reflections labeled as Refined and return to BEAM-ish
- Generate Metric - Create a metric based on the current Gaussian data
- DEA Fit - Refine the current reflection with the DEA method.
The next section displays a graph of the raw data and any Gaussian information if any exists. If Gaussian information is available each Gaussian will be drawn separately along with a line indicating the background. Finally, a composite is drawn showing how well the data was fit visually.
The last section shows information about the areas the each Gaussian covers with respect to the total area under the fit curve. The areas of the Gaussians may not add up to 100 percent because a portion of the area under the curve is taken up by the background.