Eppley Institute for Cancer Research
University of Nebraska Medical Center
| Home | - | Introduction | - | CommonTasks | - | Index | - | About |
|
Eppley Institute for Cancer Research |
|||||||||
|
University of Nebraska Medical Center |
|||||||||
|
Statistics Windows are generated by selecting "Show Stats" from the data menu.
It is possible to open more than one window at time.
Statistics Windows perform simple analysis on the mosaicities that were measured and group them by resolution, sector or both. This information allows the user a quick way to check for trends in the measurements.
When the user selects a particular row with the mouse, that reflection is displayed in the profile area. If a statistics window is already open and a user selects a reflection on the image then the corresponding row will be selected in the reflection window.
The statistics window consists of a header where the user can how the reflections are grouped for analysis. It has some additional commands accessed by the buttons along the top. Those commands are:
Fit Curves
Pushing this button will cause the Fit Manager to be displayed along. Before it is shown, all reflections that have passed the reflection filters will have their status set to "Needs Refine" with the number of Gaussians and background type set as specified in the Project Settings. The user simply has to push "Refine All" in the Fit Manager to initiate the process.
Calculate Anisotropic Mosaicity
Pushing this button will cause BEAM-ish to calculate the anisotropic mosaicity and display the result in the command window. It will show the crystal directions and the mosaicity for each direction as well as the R-squared value.
Filter File
Pushing this button will generate a column indicating the state of a reflection as filtered (1) or unfiltered (0). Filtered reflections failed to pass the filter screen and are eliminated. Values of (0) indicate good reflections. This is a little backwards from how a person may think of the meaning but this is exactly how the information is stored within BEAM-ish to make calculations simpler. If the BEAM-ish version is greater than vers 1.2 it is more useful to use the "Generate Master Report" command on the tools menu.
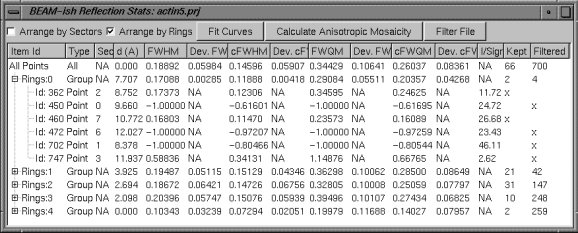
Below the header is a collapsible table. The way the table collapses is based on how the user has grouped reflections indicated by the check boxes. In the image above the user is grouping by resolution ring. Each row represents information for a group or an individual reflection. Information for a group is a sum or average depending on the header. Information that is not useful for a group or an individual reflection is represented by a NA (not applicable) indicator. The information that each row may contain going from left to right is: Item Id (Reflection Id), Type (All, Group, Point), Sector Value, Ring Value, Resolution, Full Width Half Maximum (FWHM), Deviation of FWHM, Corrected FWHM (Mosaicity), Deviation of Mosaicity, Full Width Quarter Maximum (FWQM), Deviation of FWQM, Corrected FWQM, Deviation of Mosaicity Corrected FWQM, value of Imax / Iavg, Kept (Passed Filters), Filtered (Failed Filters)
When the number of rows or columns becomes larger than the window, scroll bars appear automatically.